
This article was originally published in the August 2022 issue of Expansion Solutions magazine.
As we write this article, the May 2022 jobs report has been released showing the economy added 390,000 new jobs and 330,000 new workers to the labor force.[1] Wow!
- The unemployment rate was 3.6% for the third month in a row with 6.0 million unemployed workers, nearly recovered to pre-COVID-19 pandemic levels from February 2020 (3.5% and 5.7 million, respectively).
- Among the unemployed, the number of permanent job losers remained at 1.4 million and the number of persons on temporary layoff was at 810,000, both only a little different from their values in February 2020.
- The labor force participation rate of 62.3% was only 1.1 percentage points below February 2020 values.
Phew, the labor market crisis is over! Jobs are growing but the rapid pace of hiring has slowed and people who were reluctant to work due to COVID are returning to the labor force. It sure seems like the labor crisis was a COVID issue, so we can all go back to business as usual. Back to normal.
Not so fast! While the jobs report is better than had been anticipated, there are still signs of stress and volatility in the workforce as well as long-term structural challenges. Companies still indicate they cannot get the workers and skills they need; job seekers still cannot get the jobs they want. What is going on?
We learned from many years in economic and workforce development that nothing is as simple as it at first may seem. Most issues are complex and related to multiple contributing factors. Additionally, many of the issues in workforce development have culminated from years of transitions and trends that were occurring prior to COVID, but which were exposed (and often accelerated) during the pandemic. There are three categories within which many of the factors connect:
- Changing demographics
- Changing technology
- Changing cultures
Change has been brewing and it is occurring more rapidly than our economic and workforce systems can adapt. The result constrains economic growth and prosperity for businesses, individuals, and communities. It also further exacerbates economic equity – widening the gaps between those doing well and those who are not. Workforce and economic development must transform.
To create an understanding of workforce challenges and prepare for them it is important to look beyond day to day, month to month trends and to evaluate the longer-term trends at play, to consider ways to prepare for what might be coming, and then to invest in our capacity to adapt and act.
Macro Observations
Employment
As of 2021, the US had 161.9 million jobs.[2] The Great Recession in 2008 resulted in a 6% decline in employment over 3 years and recovery was slow, returning to 2007 levels in 2014. Then the pandemic brought another dramatic drop of 5% in 2020, but recovery began immediately in 2021 (although jobs are not projected to recover to pre-pandemic levels until 2025). Despite these two recessions, the overall trend has been employment growth, with 10% more jobs in 2021 than in 2001 and a projected 7% more jobs in 2032 than in 2021.

Labor Force Participation
Percentage wide, less people are participating in the labor force. As of May 2022, the labor force participation rate in the US is 62.3%, still below the pre-pandemic rate of 63.4%. One explanation about the current workforce shortage is that workers dropped out of the labor force due to the pandemic and have not yet returned. And while it is true that labor force participation was significantly impacted by the pandemic — April 2020’s rate of 60.2% was the lowest it had been since 1973, and the 4.0% drop in the rate between March and April 2020 was the largest single-month drop in participation since at least 1948 — it is part of a much longer trend. The US labor force participation rate peaked at 67.1% for 4 years between 1997 and 2000. It has been on a path of decline ever since, with participation decreasing by 8.1% since 2000.

A few key trends can help to explain why labor force participation has been on a long-term decline:
Changes in the shares of the age groups have contributed to the overall decline in participation rate. The largest increases in the labor force participation between 2015 and 2020 was among older workers, with workers aged 65-74 increasing by 5% and workers 75 years and older increasing by 10%.[3] Meanwhile, the “prime” working age population (25-54 years old) averaged only 1% growth since 2015. While it may appear that older workers (55+ years) are accounting for a larger share of the workforce, it is a function of the size of this generation of workers moving into the 55+ category.[4] Their participation rate is lower than the aggregate, so an increase in their numbers is in fact negatively contributing to the overall participation rate.

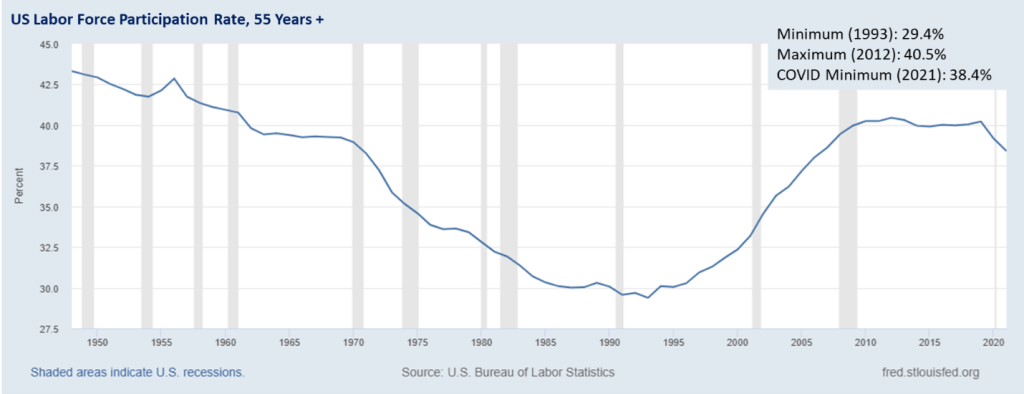
After a long-term trend of declining participation among workers 55 and over, participation started to increase in the mid-1990s. This is likely due to a number of structural changes in the economy, including changes in Social Security, increased life expectancy and their associated rising healthcare costs, increased eduational attainment (which is associated with greater rates of participation), and changes to private retirement plans.[5]
Over half of missing workers are due to “excess” retirements during COVID.[6] There were 4.2 million more exits from the labor force than expected between March 2020 and July 2021, and 2.4 million of those were retirements. About 1.5 million of those retirees have since reentered the workforce; however, there is evidence that these retirees tended to be in low-wage, low-skill jobs. There is concern that their re-entry may have been due to economic necessity and that their new jobs may be even lower-wage roles.
Teens and young adults are working less.[7] Until 2001, over half of all teenagers had jobs (usually seasonally) and they accounted for a larger share of the workforce than workers over 55. Teen employment reached its peak of 57.9% in 1979, then gradually reduced to an all-time low of 34.0% by 2014. This trend is likely due to the growing importance of our knowledge-based economy, with teens and young adults (and their parents) placing a higher priority on academics than entry-level employment. Participation has been increasing slightly in the past few years and is at 36.2% as of 2021.

Men’s participation has been declining.4 While women’s participation increased by 76% since 1960, men’s has decreased by 9%. As of 2021, men’s participation is at an all time low of 88.0%, compared to the 62-year high of 97.0% in 1960. Decreases in men’s participation are more likely for those with less education, which may be due to the shrinking number of traditional, labor-intensive jobs as our economy becomes more knowledge-based and automated.[8],[9]

Job Openings
The stress that employers are experiencing in finding workers is evidenced in job opening data. The US has nearly twice as many open jobs as available workers.[10] There are currently 11.5 million job openings across the US, but only 6.1 million unemployed workers. Even if the unemployment rate was at 0%, there would still be 5.3 million vacant jobs. This is the largest gap the US has seen in available workers compared to job demand in the past 22 years. However, this is not a new trend.

Coming out of the Great Recession, the US began a long, slow recovery, as openings began to climb while unemployment and labor force participation lowered. As the economy began to reach equilibrium around 2015, employers began to sound the alarm about labor shortages, reaching a critical point in 2018, the first time that openings exceeded the number of unemployed workers. The workforce crisis we are experiencing now is a continuation of that trend, despite (not because of) the pandemic. As the chart above shows, the spike in unemployment and slight drop in openings was quickly overcome, and we are now seeing an intensification of the labor force stress employers were experiencing prior to the pandemic.
Occupations
Looking back to 2001, a long-term trend in occupations is revealed: Lower skill and lower wage jobs are decreasing, and higher skill and higher wage jobs are driving growth. The chart below shows all 2-digit occupation groups in the US, except for Farming and the Military.[11] The Occupation groups are plotted based on historical growth rates (the x-axis), their average hourly earnings (the y-axis, with occupations that fall below the x-axis intercept earning less than the median hourly wage), and employment (bubble size). Overall occupation trends include:
- The occupations with the greatest job losses are low-wage/low-skill. Production (-25%), Office and Administrative (-13%), Construction (-5%), Sales (-4%), and Building and Grounds Maintenance (-1%) occupations have cumulatively lost over 7.1 million jobs since 2001. All of these occupations fall well below the national median wage of $27.29 and are generally low-skill jobs.
- The majority of occupations are low-wage. The average hourly earnings for over 68% of the occupations fall below the nation median wage of $27.29 per hour.
- The largest occupations are low-wage. Office and Administrative occupations account for the largest share of employment in the US, with over 12% of jobs. Other large occupations include Sales (9%), Transportation and Material Moving (9%), and Food Preparation and Serving (7%). Together, these occupations account for 38% of the workforce, and all offer relatively low average wages.
- High-wage occupations are driving growth. Occupations earning more than $27.29 per hour on average have added 13.1 million jobs since 2001, which accounts for 93% of total growth. High-wage/high-growth occupations currently account for 32% of jobs. These occupations include Business and Financial Operations, Computer and Mathematics, Healthcare Practitioners and Technicians, Management, and Legal occupations.

While one would think this is a good trend, it does come with significant challenges which are holding back future economic growth, prosperity, and equity. Those workers losing lower skill and lower wage jobs are not automatically transitioning to the higher skill higher wage jobs. Not only do such transitions take time for people to get trained and experienced, but also it takes time to transform the education and training culture and systems. In the meantime, many workers are losing jobs and are unable to attain better jobs in growth occupations. Additionally, significant barriers further suppress opportunities for training, education, and job attainment, including support systems around family care, housing, and transportation.
Understanding Change
Aging Demographics
The US has seen steady population growth over the past few decades, adding 46.7 million people between 2001 and 2021 for a growth rate of over 16%.[12] On average, the population grows by 0.8% per year, and there have not been any declines over this period. However, this positive growth trend is overshadowed by trends within different age groups within the population.
The 55+ population has been growing dramatically. As of 2021, there are 99.6 million people aged 55 or older in the US, accounting for 30% of the population.[13] In 2001, there were 60.4 million people in this age group, which means this cohort grew by 65% in the past 20 years. This trend is expected to increase over the next decade, with an additional 12% increase in the population aged 55 and over, resulting in an 84% increase between 2001 and 2032. By 2032, this age group is projected to account for 32% of the total US population.
The “prime” working aged population is growing slowly, but its share of the population is decreasing over time. As the population ages into the 55 and over cohort, the 25 to 54 cohort is shrinking relative to the overall population.[14] As of 2021, there are 129.2 million people in this age group, accounting for 39% of the total population. This age group grew by just over 4% since 2001, and it expected to add an additional 5% by 2032. This cohort’s relatively slowly growth (9% from 2001 – 2032 compared to 84% for those 55 and over) is resulting in the shrinking of the prime working aged population.
The younger populations are either stagnating or declining over time, which indicates this trend will continue into the future. The youngest workers in the 15 – 24 cohort currently account for 13% of the population, but their anticipated growth rate of 6% between 2001 and 2032 is low relative to the two cohorts ahead of them.12 Meanwhile, children under the age of 15 are losing population, with an overall growth rate of -1.39% over this period.
By 2032, the “prime” working aged population cohort will only be 7% larger than the 55 and over cohort, compared to 9% today and 22% in 2001. The implications for the workforce are clear – we will have even fewer workers going forward than we do today – but these trends are also likely to increase the demand for labor-intensive (and low-wage) jobs in eldercare, while resulting in shortages in occupations like childcare which are critical to the labor force’s ability to participate in the economy.

Place of Work: Remote Work
COVID saw the acceleration of remote work, much borne out of necessity, some out of choice. However, this trend was occurring prior to the pandemic. The advance of the digital economy and penetration into all sectors has enabled more work to be performed remotely. This has had many benefits including allowing companies to recruit workers from anywhere and allowing workers to exercise choice and expand their job opportunities. Both employers and employees have also expanded their skills at integrating digital communications, collaboration, and work processes while expanded and improved platforms and digital tools have further enabled the trend. Much is being written as to whether this trend is likely to continue. Those claiming it is a fad and work will return to primarily being “at place” are missing how much the trend was occurring prior to COVID and underestimating how digital technologies are transforming our work environments. Similarly, those claiming the trend will accelerate and eventually be the predominate way that work gets done understate the role that “place” plays for jobs needing to be done in-person – for example, construction and direct care for an elderly client – and the preferences of workers and industries that best communicate and collaborate in-person.
The reality of the near- and mid-term future likely lies somewhere in the middle: remote work will continue and even grow, but at lower levels than were necessitated by COVID. This is a classic case of complex issues: they are usually best characterized and approached as “and” as opposed to “or.” In this case, work will be remote in some instances, in-person in some instances, and hybrid in others. The occurrences will be driven by a combination of worker choice, employer need, and the type of work, all interacting in the marketplace.
“Proximity required (in different aspects such as to co-workers, to customers, to partners, to work site) is now a critical dimension when considering workforce needs. Work arenas vary widely in terms of the potential long-term impact of COVID-19. In the computer-based office work arena, 70 percent of time could be spent working remotely without losing effectiveness, compared to most other arenas, where as little as 5 to ten percent of work could be done remotely.”[15]
Considering these long-term trends, how will employers, workers, and communicate navigate to create economic opportunity? Employers must determine what is necessitated and aligned with their culture and practices including providing training, technology, and opportunities for team building and collaboration. Which approaches they allow or require regarding place of work is less important than their alignment with the market, culture, and practices. Workers must align their preferences with the needed skills and job opportunities. Communities must develop environments where both business and workers (including remote) want to be, including infrastructure, amenities, and policies.
Tech of Everything
Technological change has occurred in the economy since our beginnings. It was accelerated by the industrial revolution and then the digital revolution. The digital revolution not only created new industries, but it has – and will continue to – transform every industry from agriculture, to healthcare, to manufacturing, to transportation, to services and beyond. Essentially, all industries have become “tech industries” in terms of reliance on technology for operations, efficiencies, and new innovations. This “tech of everything” trend has been developing for many years and has dramatic impacts on the workforce in terms of both challenges and opportunities. “The nature of work is changing rapidly. Technological changes— in particular advancements in machine learning and deep learning —have sparked alarmist predictions of massive job obsolescence. Even conservative estimates indicate that significant proportions of the work humans do today will be automated in the coming decade. At the same time, technological advancements will continue to give rise to entirely new types of jobs. Futurists estimate that up to 85 percent of the jobs that will exist in 2030 haven’t been invented yet.” [16]
All industries and occupations need increasingly advanced skills to reflect the integration of digital technologies. This includes skills and occupations needed to develop and apply digital technologies, to work along with and enhance digital capabilities, and skills that are not best performed through digital technologies.
Full disruption and then integration of new technology rarely happens all at once. Jobs impacted and even lost will not occur overnight. However, changing our learning, training, and workforce practices requires the involvement of many individuals, organizations, and institutions, which will take years to transform. Therefore, it is essential that we prepare for the long-term by starting now.
“The labor market impacts of technologies like AI and robotics are taking years to unfold. But we have no time to spare in preparing for them. If those technologies deploy into the labor institutions of today, which were designed for the last century, we will see similar effects to recent decades: downward pressure on wages, skills, and benefits, and an increasingly bifurcated labor market.”[17]
Importance of Skills
As discussed above, the nature of work is changing, becoming more knowledge- and technologically- based over time. Traditional entry-level and manual labor jobs are disappearing, as evidenced in the Top Occupations graph above. The types of occupations that are growing – and importantly, providing opportunities for workers – are based more on soft or “durable” skills, such as leadership, communication, critical thinking, and collaboration.[18] Durable skills account for 70% of the required skills in job postings, particularly for the jobs most aligned with the future of work. Conversely, the jobs that are most risk of automation have the least demand for durable skills.
“Human skills and abilities go by many names: soft, non-cognitive, power, common, transferable, baseline, 21st century, employability, workforce readiness, interpersonal, talent, life, and professional… These are skills that enable learners to transfer their knowledge from domain to domain in the face of job obsolescence and to learn new skills in demand. Human skills are in high demand across many industries and include skills such as leadership, collaboration, creativity, critical thinking, communication, emotional intelligence, judgment, ethics, and cognitive flexibility.”[19]
The graphic below shows how employers’ demand for skills has been changing over time. These are the most requested skills in job postings, including specialized skills (also known as technical skills or hard skills), common skills (soft skills, human skills, and competencies), software, and certifications. Across the whole range of skills that could be requested, the most in-demand are related to durable skills, and they have been growing in importance over time.

Adapting to Change and Preparing for Tomorrow’s Workforce
Based on the trends and issues examined here – along with our experience in the field working on workforce strategies for regions and states across the nation – we recommend the following strategy guidance for workforce, business, and economic developers:
Coordinate and collaborate – Workforce is everyone’s challenge and opportunity. No one sector or entity can address all of the issues and challenges outlined here alone. The impacts and consequences of our decisions and actions are collective and crucial for the health of our national economy.
Focus on skills – Skills are the biggest concern of employers and workers alike across all titles, occupations, and industries. Skills that are both in-demand and that crosscut all sectors are durable. Due to their importance now and into the future and their applications across the economy, they are an ideal focus area for the development of “collaborative skill academies” that can be designed and implemented by multisector and entity partnerships within a region.
Be “people asset oriented” – Talent attraction across geographies simply moves people around and in most all cases will not be sufficient to meet future worker demand due to mobility rates. In other words, you cannot attract your region out of the problem. Instead, focus on strategies to support your existing workforce and help them obtain the skills and training required to access and remain in the workforce. Develop and implement programs and strategies to help “hidden” or challenged workers – those not easily able to enter and remain in the workforce due to disadvantages or circumstances. We can solve both our labor force issues and help improve equity and the quality of life for our citizens if we can expand our view of the workforce, which will in turn increase participation rates and retention.
Get smart and get digital – Just as digital technology is changing work, it is also changing what we know about workers and jobseekers and how we do workforce development. Digital approaches and tools need to be continually integrated into workforce development, including job fairs, virtual experiences for learning and skills training (including gamification), and data analytics.
Move from short-term trend reaction to near- to mid-term foresight approaches – Look at data over the longer term while also considering what might happen in the near future. Then, engage with partners around the possibilities, scenarios, and implications for the near- to mid-term. With rapid change, the future is less predictable.
Most importantly, start preparing today!
Jim Damicis is Camoin Associates’ Senior Vice President. He has more than 25 years of experience in public policy research and analysis. Jim brings a holistic, innovative approach to Camoin’s data-driven economic development planning efforts. Through his work with the Communities of the Future and World Future Society, he is a national leader in preparing the profession, communities and regions for an emerging economic future.
Mara Klaunig was a senior research analyst at Camoin Associates. She has over ten years of experience consulting for a wide array of clients across the nation, including local and regional economic development organizations, higher education institutions, non-profits, utilities, public transportation, and private developers. Mara creates customized research and analysis methodologies that help economic and workforce development clients make informed policy decisions.
[1] The Employment Situation, May 2022, Bureau of Labor Statistics, The Employment Situation – May 2022 (bls.gov)
[2] Emsi
[3] US Bureau of Labor Statistics
[4] The Composition Effect in the Labor Force Participation Rate, FRED, August 2015, The composition effect in the labor force participation rate | FRED Blog (stlouisfed.org)
[5] Labor Force Participation: What Has Happened Since the Peak? Monthly Labor Review, September 2016, US Bureau of Labor Statistics, Labor force participation: what has happened since the peak? : Monthly Labor Review: U.S. Bureau of Labor Statistics (bls.gov)
[6] Millions Retire Early During the Pandemic. Many Are Now Returning To Work, New Data Show, May 2022, https://www.washingtonpost.com/business/2022/05/05/retirement-jobs-work-inflation-medicare/
[7] St. Louis Federal Reserve, participation | Search Results | FRED Blog (stlouisfed.org)
[8] Labor Force Participation: What Has Happened Since the Peak? Monthly Labor Review, September 2016, US Bureau of Labor Statistics, Labor force participation: what has happened since the peak? : Monthly Labor Review: U.S. Bureau of Labor Statistics (bls.gov)
[9] Hidden Workers: Untapped Talent, September 2021, https://www.hbs.edu/managing-the-future-of-work/Documents/research/hiddenworkers09032021.pdf
[10] US Bureau of Labor Statistics
[11] Emsi
[12] Emsi
[13] Aggregated from the US Census Bureau, American Community Survey and Emsi
[14] Aggregated from the US Census Bureau, American Community Survey and Emsi
[15] The Future of Work after COVID‑19, McKinsey Global Institute, February 2021, www.mckinsey.com/featured-insights/future-of-work/the-future-of-work-after-covid-19
[16] Machine Partnerships: Emerging Technologies’ Impact on Society and Work in 2030, Institute for the Future, The Next Era of Human, 2017 as quoted in Robot-Ready: Human+ Skills for the Future of Work. Strada Institute for the Future of Work, https://stradaeducation.org/institute-for-the-future-of-work/
[17] The Work of the Future: Building Better Jobs in an Age of Intelligent Machines, November 17 2020, https://workofthefuture.mit.edu/research-post/the-work-of-the-future-building-better-jobs-in-an-age-of-intelligent-machines/
[18] The High Demand for Durable Skills, America Succeeds and EMSI Burning Glass, October 2021, https://americasucceeds.org/portfolio/the-high-demand-for-durable-skills-october-2021#:~:text=Demand%20is%20greatest%20in%20jobs%20more%20aligned%20to,than%20the%20top%205%20technical%20or%20hard%20skills.
[19] Robot-Ready: Human+ Skills for the Future of Work, November 2018, Strada Institute for the Future of Work, Strada (stradaeducation.org)