
- Navigator
- South
- Featured Indicator
- State
- Strategic Planning & Doing
The University of South Carolina’s Hazards and Vulnerability Research Institute has developed a model of measuring community resiliency in South Carolina as part of its Baseline Resilience Indicators for Communities (BRIC). Here at Camoin Associates, we like to incorporate this data into strategic plans and other resilience-focused work. County-level data is available for two time periods (2010 and 2015) and can be downloaded directly from the University of South Carolina or accessed through PolicyMap.
The data includes an overall resilience score, which is the sum of scores in six subcategories: social, economic, infrastructural, community capital, institutional, and environmental resilience. Components of these categories are listed below:
Using South Carolina as an example, we took a look at the data to understand which counties are outperforming on these measures of resiliency, compared to the state. Resilience scores in each subcategory can range from 0 to 1, where higher score correspond to higher resilience. The overall resilience score, shown in the map below, is the sum of the scores in all subcategories.
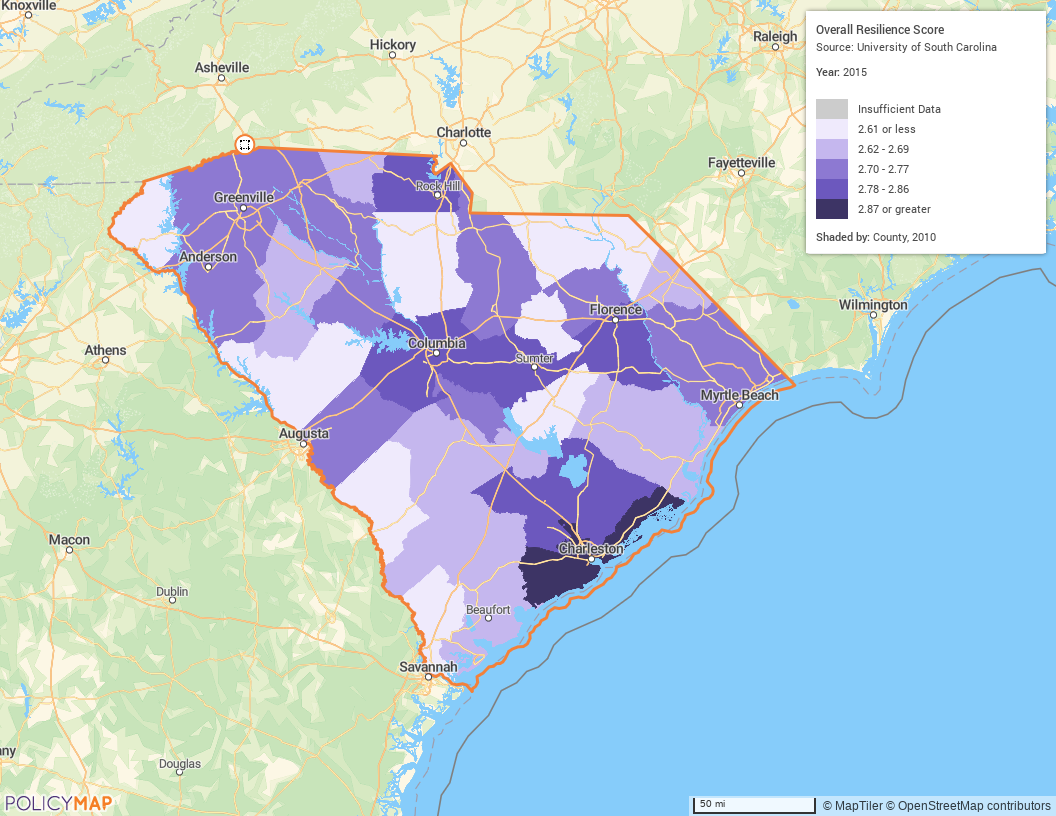
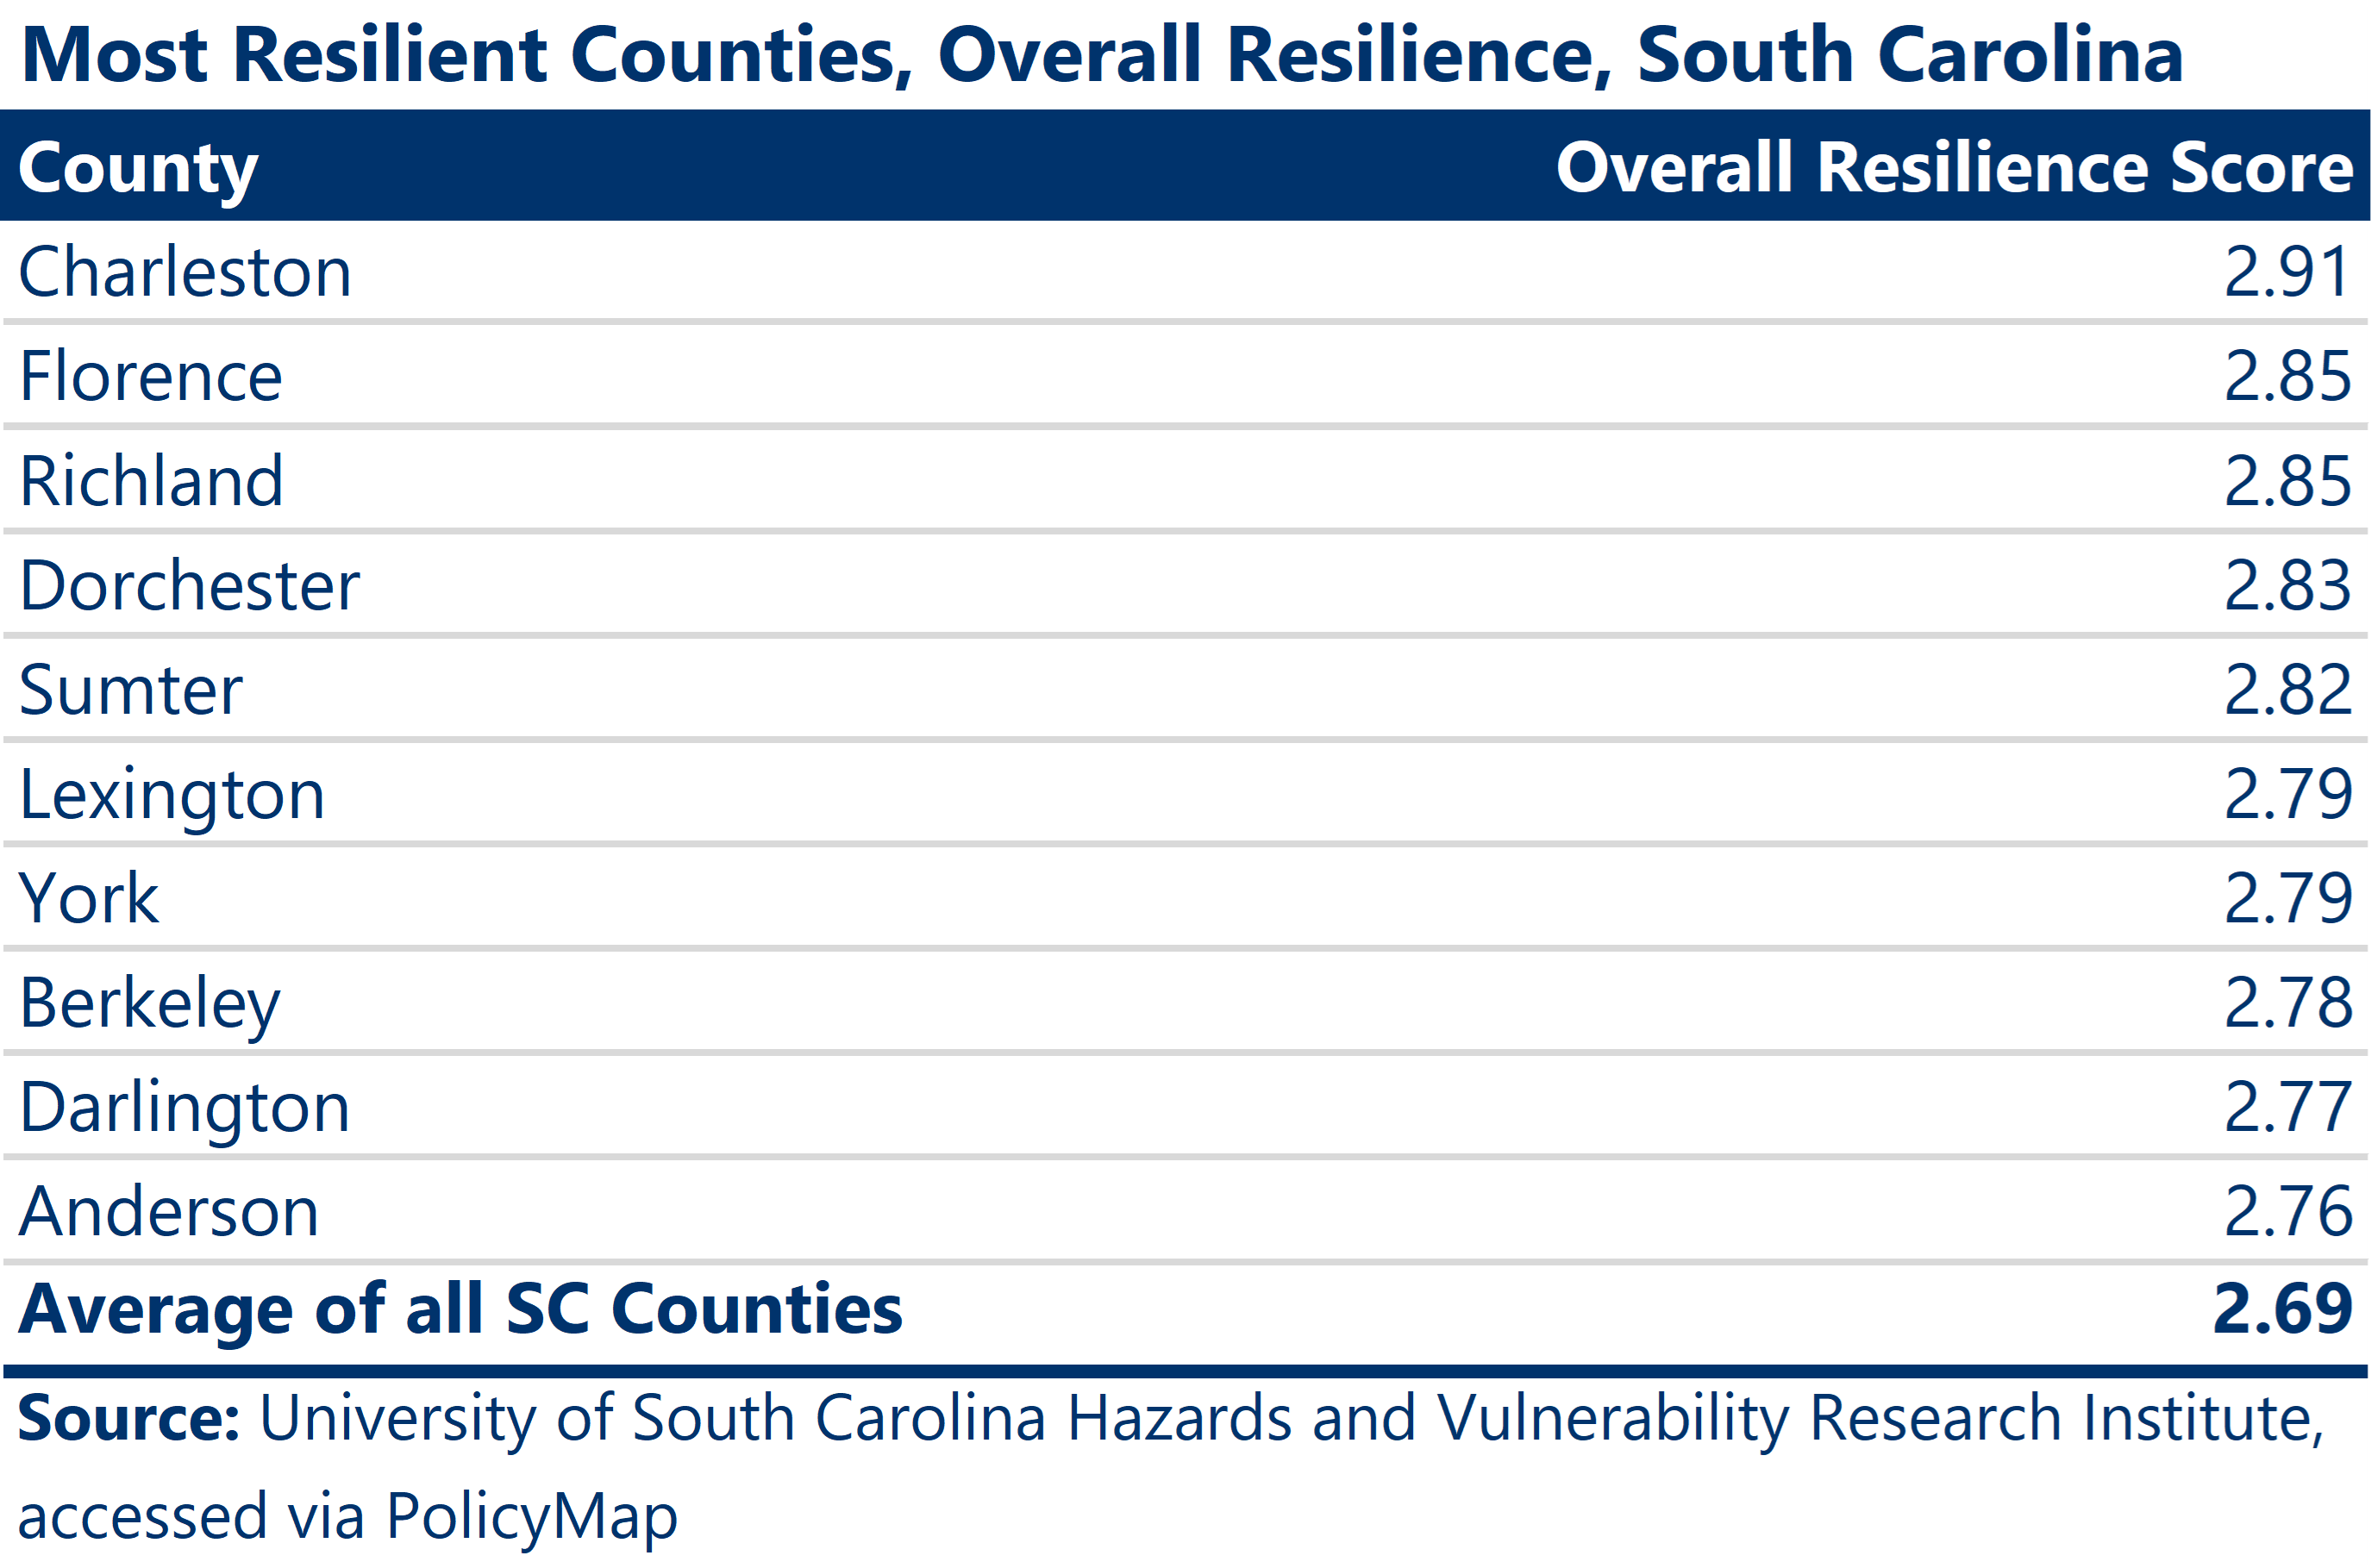
Within South Carolina, Charleston County has the highest overall resilience score of 2.91. This is followed by Florence and Richland Counties, with scores of 2.85. The average overall resilience score of all South Carolina counties is 2.69.
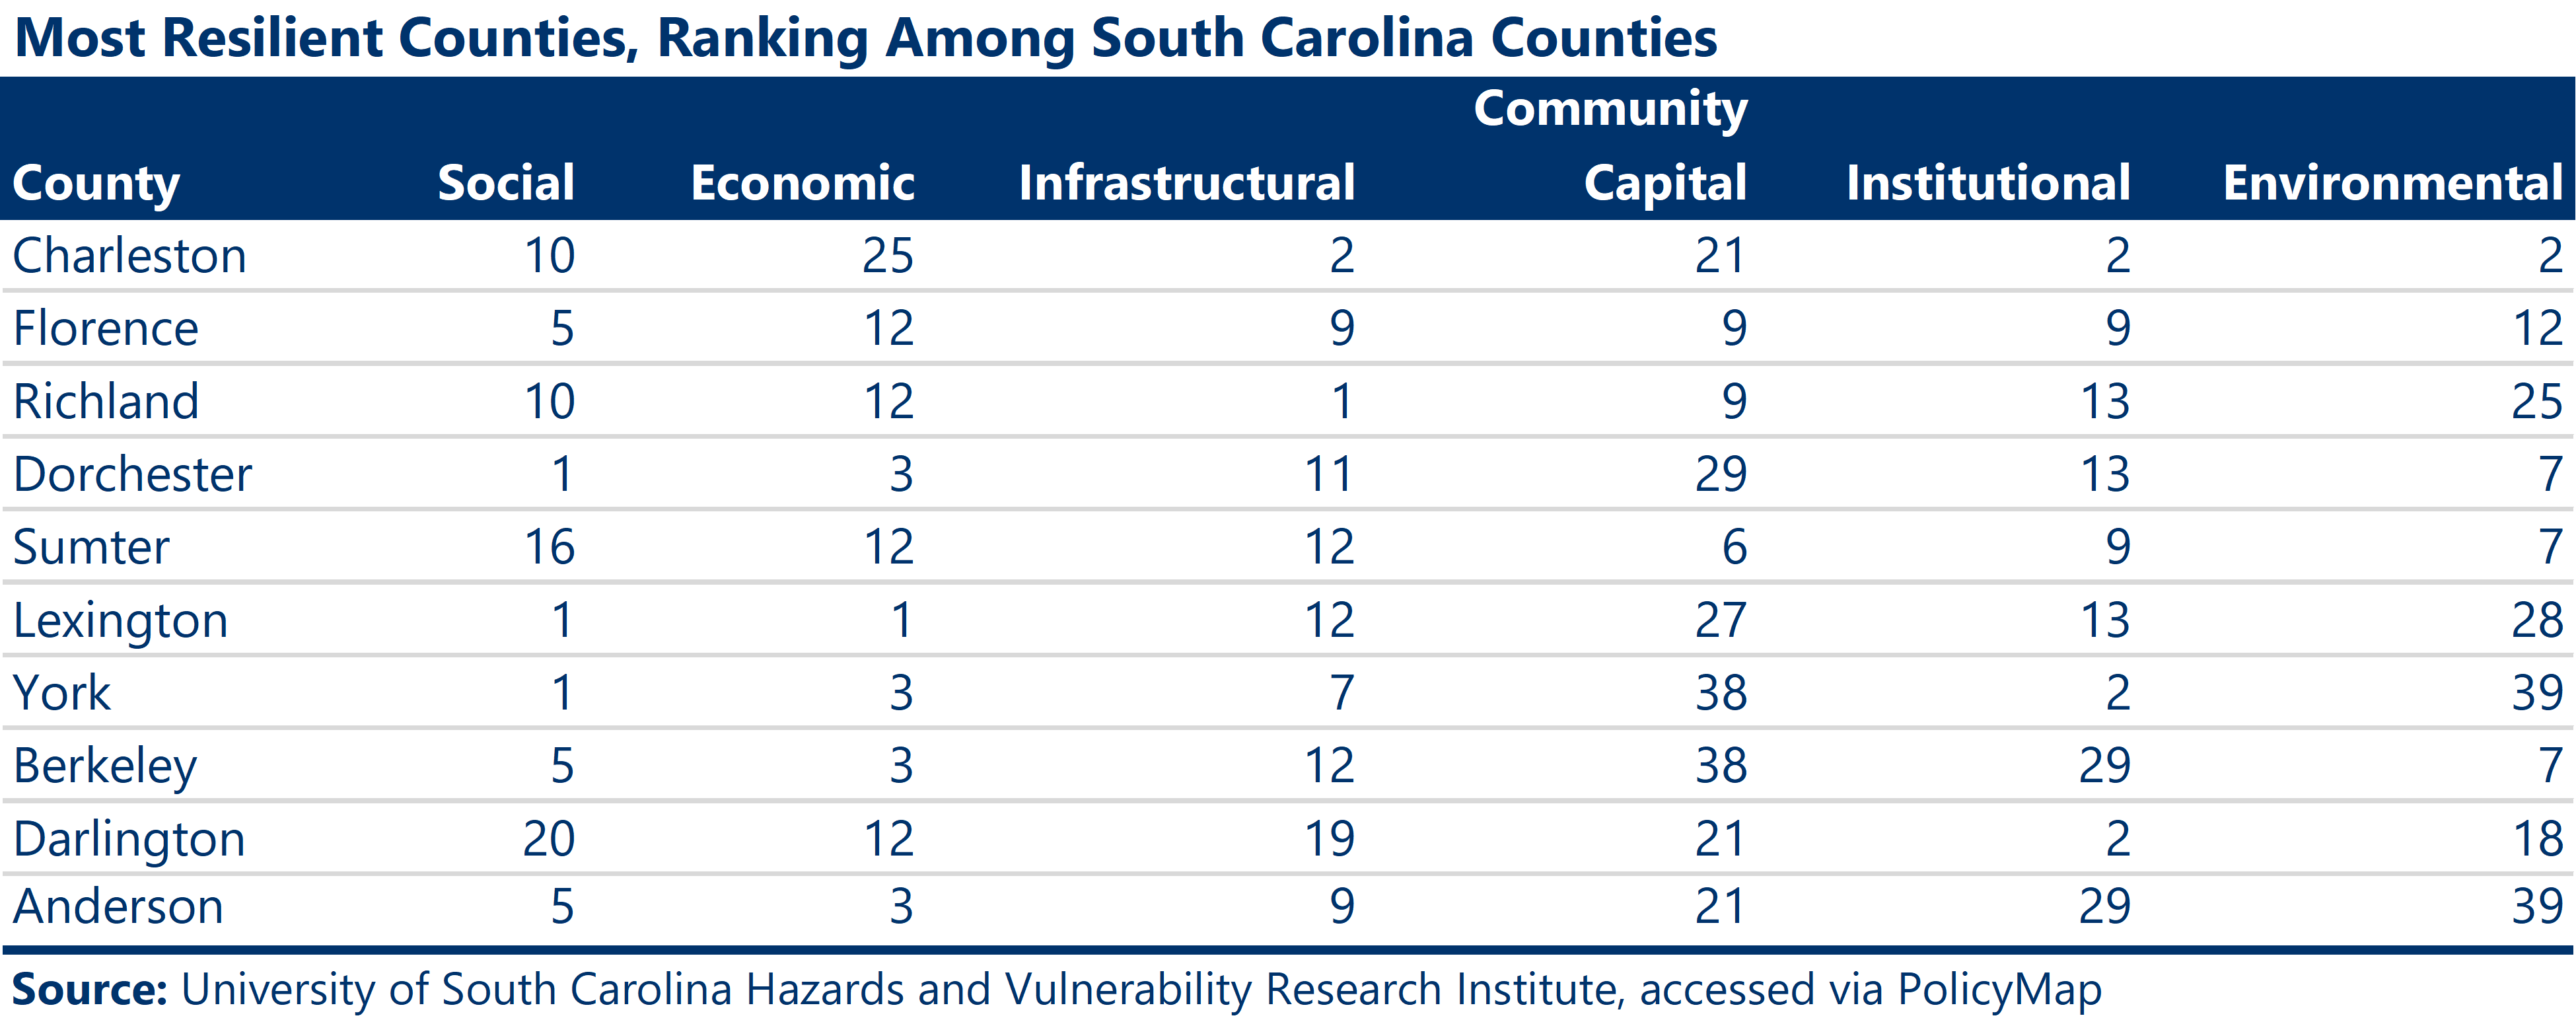
Charleston County, the county with the best overall resilience score ranks highest in the infrastructural, institutional, and environmental resiliency categories (second out of 46 counties). The rankings for the other top 10 most resilient counties by category are included in the below table.
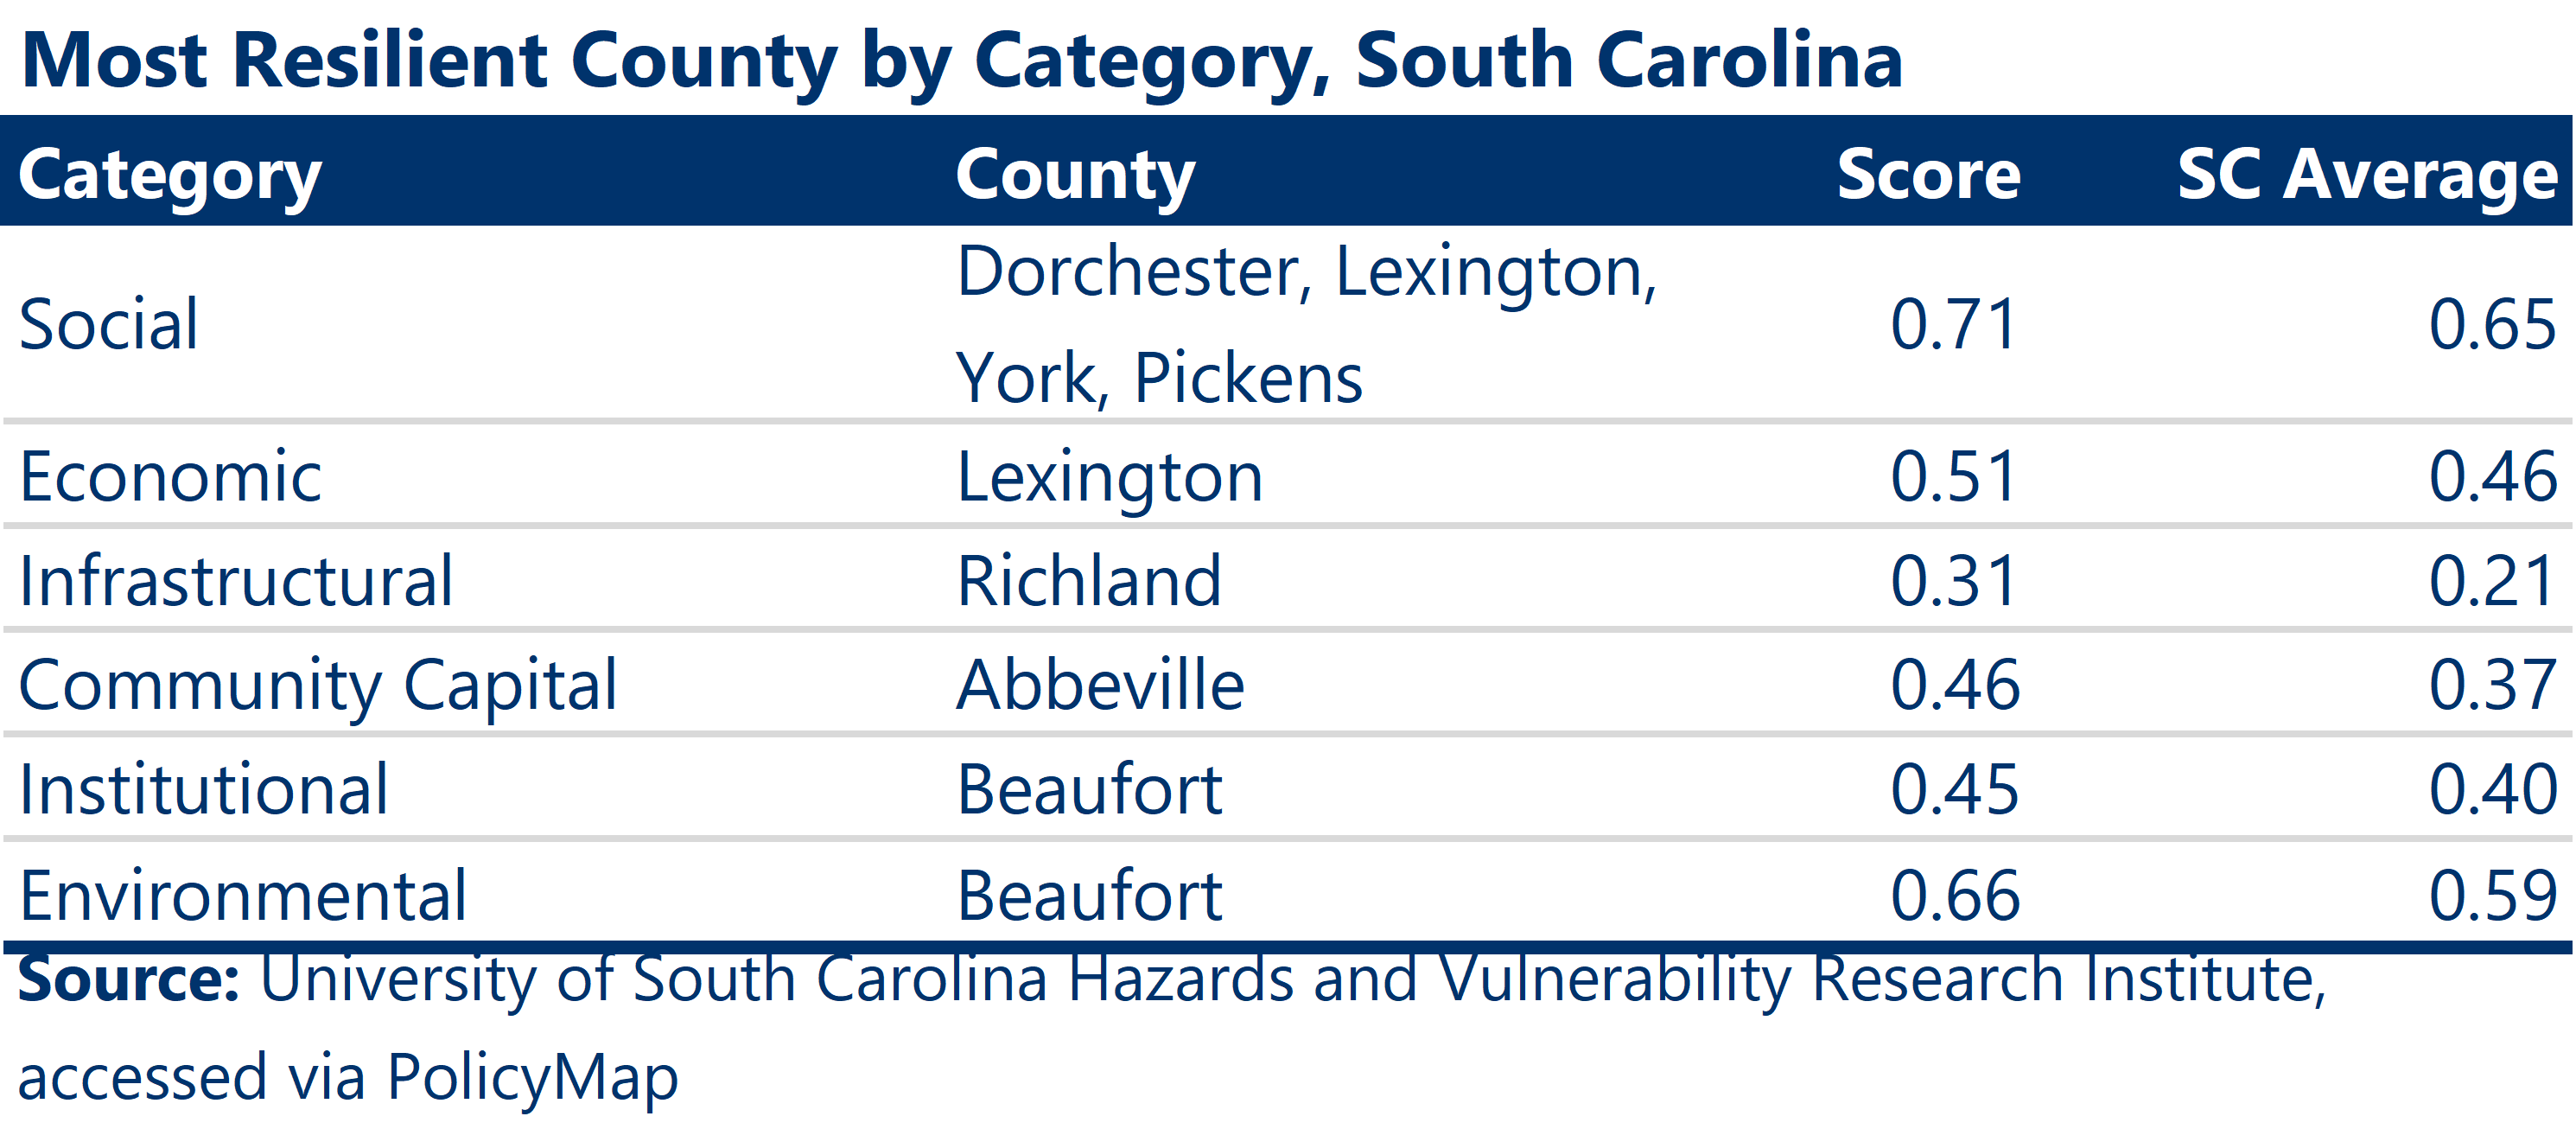
Different counties within the state have different resiliency strengths. Beaufort County, for example, is the top ranked county in terms of institutional and environmental resiliency. Dorchester, Lexington, York, and Pickens counties are tied for the highest social resiliency scores, while Lexington County has the highest economic resiliency score, Richland County has the highest infrastructural resiliency score, and Abbeville County has the highest community capital resiliency score.
According to Camoin Associates’ own Dan Gundersen, “A community’s economic resiliency is determined by the ability of its leaders to anticipate these risks and evaluate the impacts, plus their capacity to make sound decisions involving diverse inputs, and their willingness to take proactive (and possible unpopular) actions to minimize such risks.” Key to this is understanding where your community falls currently in terms of economic resiliency and where investments should be made to improve resiliency. This data, along with other measures such as the Hachman Index, can help communities move towards this understanding.
For more information on resiliency, check out Dan Gundersen’s article, “The Secret to Economic Resiliency (It’s Not What You Think)” or visit Camoin Associates’ Resiliency Resources webpage.

Workforce Development
What’s the best way to engage with young people in order to pique their interest in career opportunities in different sectors? Find out what a group of high school students recently told our author.

Industry Analytics

Economic & Fiscal Impact Analysis
Your resource for understanding today and looking toward tomorrow