- Navigator
- Featured Indicator
- Industry Analytics
- National

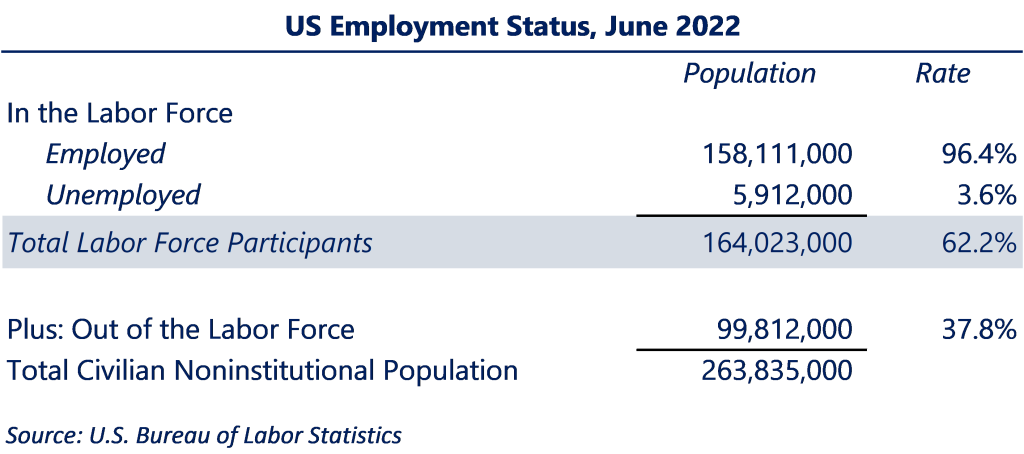
In June 2022, the US civilian labor force participation rate (LFPR) was 62.2%, according to the US Bureau of Labor Statistics.[1] The good news is that this is a 2% increase over the historic low set in April 2020 of 60.2% (the last time the rate was this low was in 1977), although it is still below the pre-pandemic rate of 63.4% in February 2020. The bad news is that the data also indicates the long-term decline in the labor force participation rate, which began back in 2000, is continuing.

The LFPR is the total percentage of US residents in the labor force. It represents the relative amount of labor available to produce goods and services in our country. The rate includes civilian, non-institutional people age 16 and over who are currently working or are unemployed and actively looking for a job. It does not include those who are unemployed and not actively looking for a job. The LFPR is released monthly by the US Bureau of Labor Statistics based on household survey data.
What is the Data Telling Us?
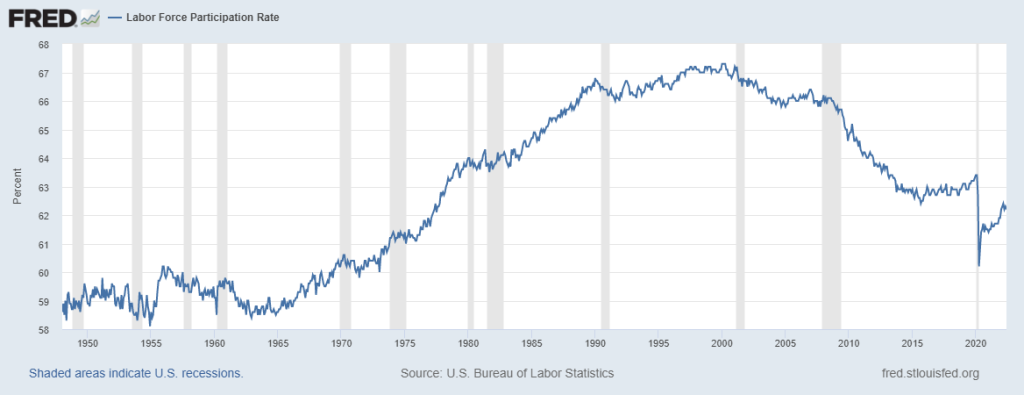
While the recent gains indicate the labor force is recovering from the COVID-19 pandemic, the fact remains that the LFPR in the US has been on a long-term decline since 2000. A look at this graph from the St. Louis Fed shows its trajectory since 1948.[2]

The LFPR rose sharply between the mid-1960s and 1990. This surge was largely a result of women entering the workforce in unprecedented numbers. Through the 1990s, the LFPR hovered between 66% to just over 67%, peaking in January 2000 at 67.3%.
Thereafter, the rate began its descent and was hovering around 63% in the five years prior to the pandemic. The COVID-19 pandemic resulted in a 4% drop in the rate between March and April 2020 (the largest single-month drop since data collection began in 1948). However, even prior to the pandemic, the LFPR was at its lowest since the recession of the mid-1970s. Overall, the LFPR has decreased by 5.8% between 2000 and 2020.
The US labor force is undergoing long-term structural changes as it has been for some time. There are multiple factors that are contributing to our shrinking workforce, including:
- Aging population: Workers 65 years old and older are the fastest growing segments of the labor force, but they tend to participate at lower rates than the overall population.[3]
- Teens and young adults are working less: Teen employment reached its peak of 57.9% in 1979, then gradually reduced to an all-time low of 34% by 2014. This trend is likely due to the growing importance of our knowledge-based economy, with teens and young adults (and their parents) placing a higher priority on academics than entry-level employment. [4]
- Men’s participation has been declining: As of 2021, men’s participation is at an all time low of 88%, compared to the 62-year high of 97% in 1960. Decreases in men’s participation are more likely for those with less education, which may be due to the shrinking number of traditional, labor-intensive jobs as our economy becomes more knowledge-based and automated.[5]
- Other structural changes have also impacted the LFPR, including slow population growth, declining fertility rates, declining immigration, changes in Social Security, increased life expectancy and their associated rising healthcare costs, increased educational attainment (which is associated with greater rates of participation), and changes to private retirement plans.[6]
Why is Labor Force Participation Data Important?
Employers consistently report that they cannot find qualified workers. The stress that employers are experiencing finding workers is evidenced in job opening data: the US has nearly twice as many open jobs as available workers.
As of June 2022, there are 11.3 million job openings across the US, but only 5.9 million unemployed workers. [7] Even if the unemployment rate was at 0%, there would still be 5.3 million vacant jobs. This is the largest gap the US has seen in available workers compared to job demand in the past 22 years.
Given this shortage of workers within the labor force, it is important to note that while some portion of the falling labor force participation rate can be explained by demographic and social trends, a large share of the population that could work is not currently looking for a job. People who are jobless but have stopped looking for work are not included in the unemployment rate, even if they would like to work if the opportunity arose.
As of June 2022, over 99.8 million people — or 37.8% of the civilian noninstitutional population — are not participating in the labor force.[8] The population not currently participating in the workforce likely do so for a variety of reasons, including:
- lack of skills necessary in a knowledge- and technology-based economy
- lack of support for working parents (including childcare and housing)
- general inability of wages to keep pace with rising living expenses
To combat the declining labor participation rate and growing workforce shortages, communities and employers will need to start identifying segments of the population that could be brought into an active role in the labor force and work towards reducing the barriers to participation.
Does your community or organization need a targeted, data-driven industry or workforce development strategy? Camoin Associates is a national leader in research and data analysis. Contact us to learn more about our Industry and Workforce Analytics services.
________________________________________________________________________________
[1] Employment Situation Summary Table A. Household data, seasonally adjusted – 2022 Q02 Results (bls.gov)
[2] Labor Force Participation Rate (CIVPART) | FRED | St. Louis Fed (stlouisfed.org)
[3] The composition effect in the labor force participation rate | FRED Blog (stlouisfed.org)
[4] St. Louis Federal Reserve, participation | Search Results | FRED Blog (stlouisfed.org)
[5] Labor Force Participation: What Has Happened Since the Peak? Monthly Labor Review, September 2016, US Bureau of Labor Statistics, Labor force participation: what has happened since the peak? : Monthly Labor Review: U.S. Bureau of Labor Statistics (bls.gov)
[6] Labor Force Participation: What Has Happened Since the Peak? Monthly Labor Review, September 2016, US Bureau of Labor Statistics, Labor force participation: what has happened since the peak? : Monthly Labor Review: U.S. Bureau of Labor Statistics (bls.gov)
[7] US Bureau of Labor Statistics
[8] US Bureau of Labor Statistics


