
- Navigator
- Evaluation and Benchmarking
- Real Estate Development and Housing
- National
 Although much of the analytic work that we do is data-driven and metric-focused, our analytics team tries to add a human element to these figures to give a more holistic picture of a community’s unique situation. Uniting the human element with metrics and data results in tailored solutions and policies that address particular issues for our clients.
One metric that can be confusing to many and important to humanize is Area Median Income (AMI) and the associated AMI levels determined by the US Department of Housing and Urban Development (HUD) every year. Since AMI is used in determining eligibility for affordable housing programs at the federal and sometimes local levels, it’s particularly important that decision-makers and community members understand this metric and who, exactly, may be helped by those programs.
Each year, HUD calculates the area median income (AMI) for every geographic region in the country using data from the US Census-based American Community Survey. The area median income is the midpoint of a region’s income distribution, meaning that half of the households in a region earn more than the median and half earn less than the median. A household’s income is calculated by its gross income, which is the total income received before taxes and other payroll deductions.
In addition to calculating AMI, HUD defines and calculates different levels of AMI for geographic areas across the country by household size.
These parameters help HUD identify households that are eligible for certain housing assistance programs administered (However, the number of tiers used, and the percentage of AMI required for eligibility varies by each housing program).

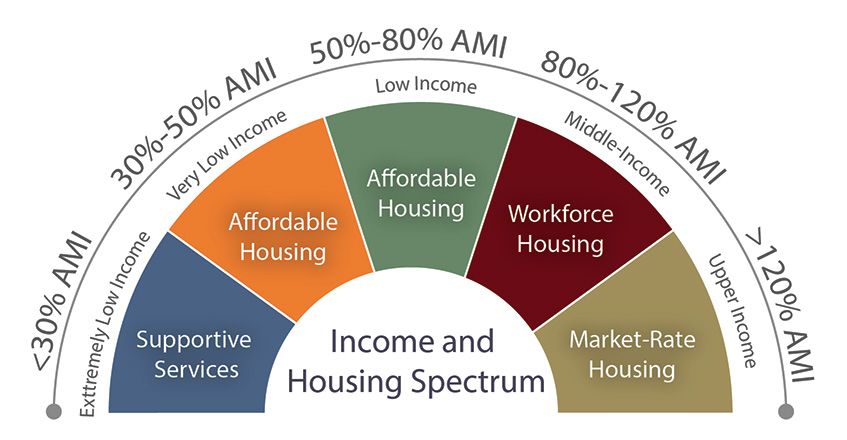
A good example of how these thresholds are used at the federal level is HUD’s Housing Choice Voucher Program. The Housing Choice Voucher Program is the federal government’s primary program for helping very low-income families, the elderly, and the disabled afford decent, safe, and sanitary housing in the private market. To be eligible for a Housing Choice Voucher, household income must be at or below 50% of the AMI.
The chart below displays the three AMI levels for households of one to six people in Broome County, NY. In this example, a one-person household in Broome County would need to have a household income at or below $26,850/year to be eligible for a Housing Choice Voucher, a two-person household (which may include a child) would need annual household income at or below $30,700 to be eligible, and so on.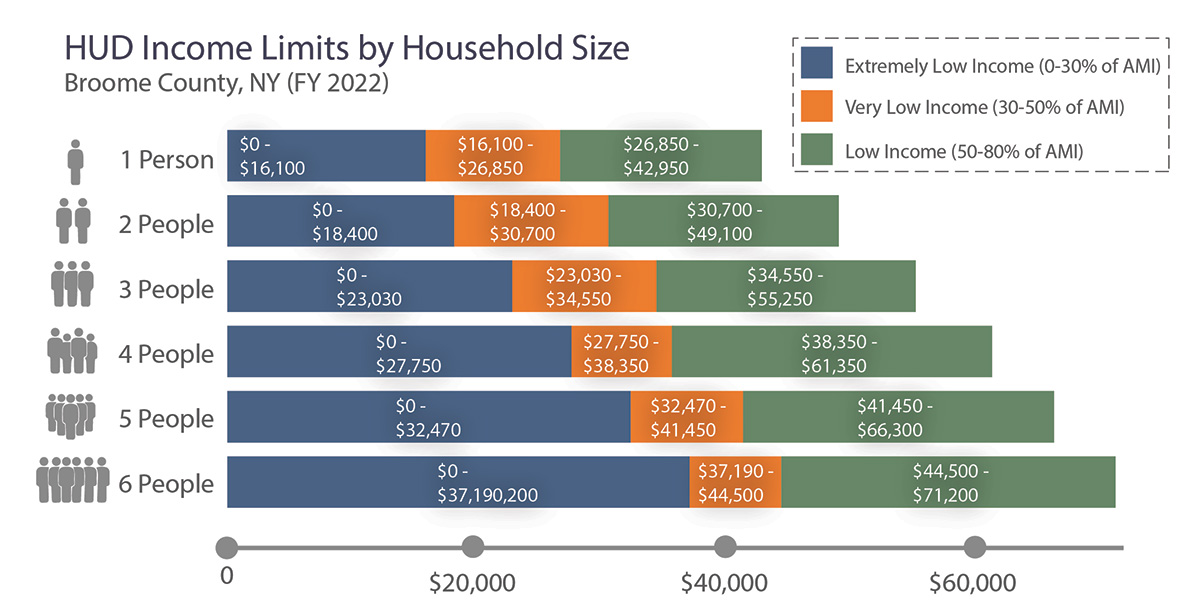
In addition to HUD, many local housing programs use AMI levels to govern eligibility for affordable housing programs. However, when initial housing policies are being contemplated, community leaders, decision makers, and other stakeholders can be left confused and wondering who, exactly, they may be helping through their housing policies. To overcome this, it can be helpful to add context and create graphics that humanize AMI metrics so that decision-makers know who they may be assisting and/or targeting through their affordable housing programs.
Below is an example of how this can be done using the data from the table above. In this figure, we overlay the median income of various occupations in the area with its AMI data. By doing this and aligning it with the individual household income level figures along the axis, it is easier to tell who fits into these AMI levels and would be eligible for local affordable housing assistance programs.
For example, if you were considering establishing a local affordable housing voucher program targeting households that earn at or below 50% of the AMI, you can now see that a family of four (two adults and two children) where one parent is a truck driver and the other takes care of the children during the day would not qualify because the household income ($46,000/year) is above the 50% AMI threshold for a family of four ($38,350).
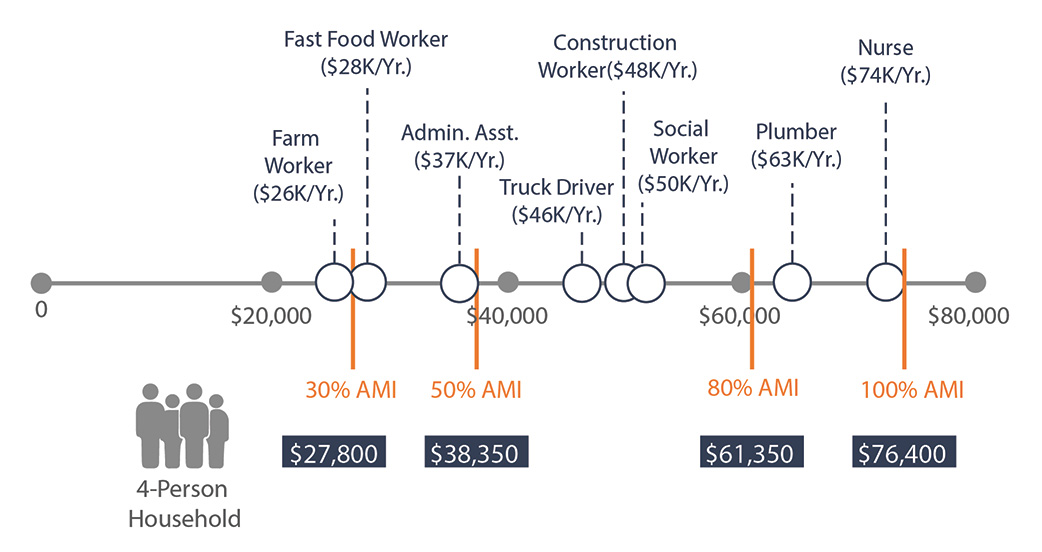
Looking at the data and metrics in this light provides more human context to the reader or decision maker by informing them about who the local program can assist based on the eligibility requirements being contemplated. They can then adjust the eligibility requirements if desired before implementing new programs.
With more and more aspects of our lives and local policies focusing on data and metrics, it is important to continue to use the human context to make the data more impactful and meaningful and help stakeholders better understand who benefits from local or regional affordable housing assistance programs.
Camoin Associates’ Real Estate Development Team offers a wide variety of housing-related services to local, state, and regional governments, non-profit organizations, and private developers. Learn more.
This article was originally published in Camoin Associates’ Economic Development Navigator blog in January 2020 and was updated in March 2023.

Real Estate Development and Housing
In 2025, the City of Albany, NY, partnered with Camoin Associates to complete a citywide housing audit that offers lessons for other mid-sized, moderate-growth cities about how to align housing policy with local economic realities while advancing equitable outcomes.

Industry Analytics and Strategy

Entrepreneurship and Innovation
Your resource for understanding today and looking toward tomorrow