United for Alice, produced by the United Way of Northern New Jersey, aims to shed light on households that earn above the Federal Poverty level but not enough to afford a basic household budget. These Asset Limited, Income Constrained, Employed (ALICE) households are not captured by traditional poverty metrics but still struggle to afford basic needs such as housing, food, transportation, child care, health care, and technology as the cost of living outpaces what they earn. Many household earners in this category power critical functions in the economy- including childcare workers, grocery store cashiers, retail salespeople, restaurant wait staffs, and home health aides. These households tend to be vulnerable to unexpected expenses but are integral to the success of communities across the nation.
The most recently released ALICE data and reports are for years 2018/2019. The next analysis will be conducted in 2022 (with 2020 data). In addition to national level data, state and county level data are available for 21 states.
What is the data telling us?
ALICE Measures
- ALICE Household Survival Budget – the bare minimum cost of household basics necessary to live and work in the modern economy.
- ALICE Household Stability Budget – an estimate of a slightly higher standard of living than the Household Survival Budget, including a 10% savings category.
- ALICE Senior Survival Budget – adjusts the Survival Budget to reflect the spending pattern of seniors.
- ALICE Threshold – the minimum income level necessary for survival for a household.
- ALICE Income Assessment – measures how much income households need to reach the threshold, how much they actually earn, how much assistance is available to help households meet their needs, and the unfilled gap that remains.
- ALICE Essentials Index – a national measure that tracks the increase in costs of specific basic necessities.
- Economic Benefits of Equity – quantifies the benefits of raising the income of all household income to the ALICE Threshold.
ALICE Data
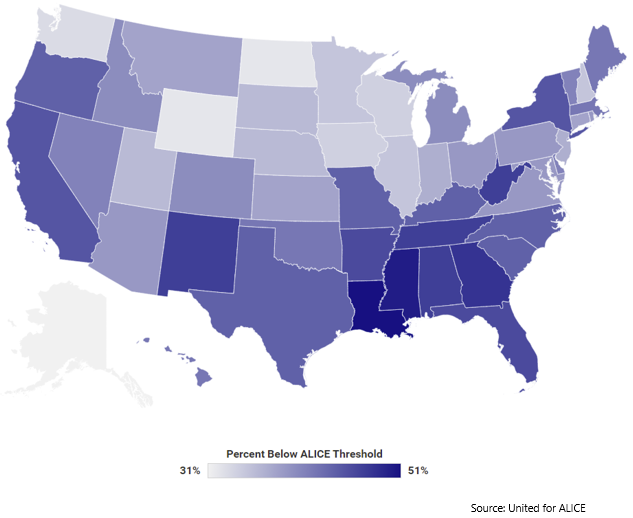
Nationally, in 2018 16 million households (13%) were in poverty, meaning they earned below the Federal Poverty Level. 35 million households (29%), more than double the number in poverty, were ALICE, meaning they earned above the Federal Poverty Level but less than the cost of living in their county. This means that in total, 42% of households in the U.S. could not afford basic necessities.
The following map illustrates the percent of households below the ALICE threshold across the states.

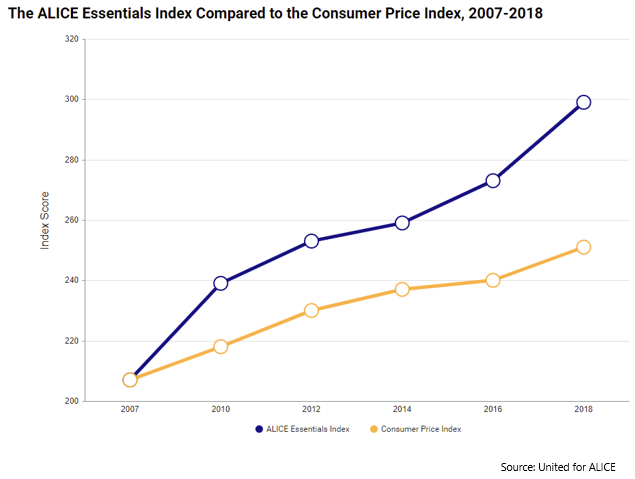
Compared to the Consumer Price Index (CPI), the ALICE Essentials Index has increased almost twice as fast over the last decade. This is because the costs of basics, especially housing and health care, have increased, while the costs of other items, such as manufactured goods like apparel and cars, have remained relatively flat.

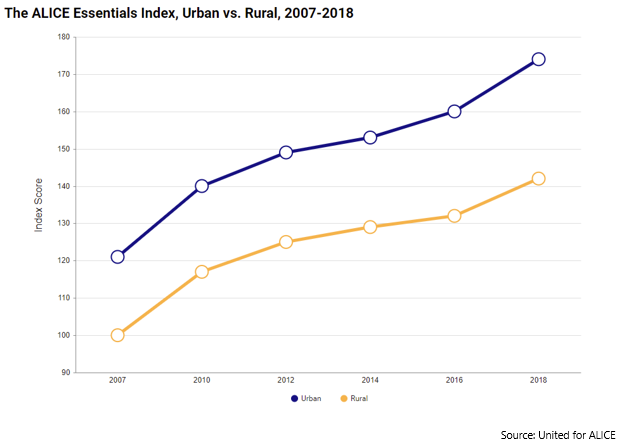
When comparing costs between rural and urban counties, the ALICE Essentials Index reveals that the cost of living has generally been 20% higher in urban areas than in rural areas, often driven by the cost of housing. While the overall cost of living in rural America is lower, the ALICE Essentials index shows that expenses are in fact rising as similar rates (for the 2007-2018 period).

Why is this important?
The Federal Poverty Level provides a nationally recognized income threshold for determining who is poor, however the measure is not based on the current cost of basic household necessities and is not adjusted to reflect cost of living differences across the U.S. This results in an understated measure of poverty. ALICE attempts to provide a more comprehensive measure of the number of households who are struggling in each county in a state using a standardized set of measurements to quantify the cost of a basic household budget, and show how many households are struggling to afford it. While there is a time lag in the data and reporting that is available, ALICE is a good tool that can be used to fully understand the extent to which households in a region are struggling.
Image Source: Adobe Spark and Camoin 310