
- Navigator
- Featured Indicator
- National
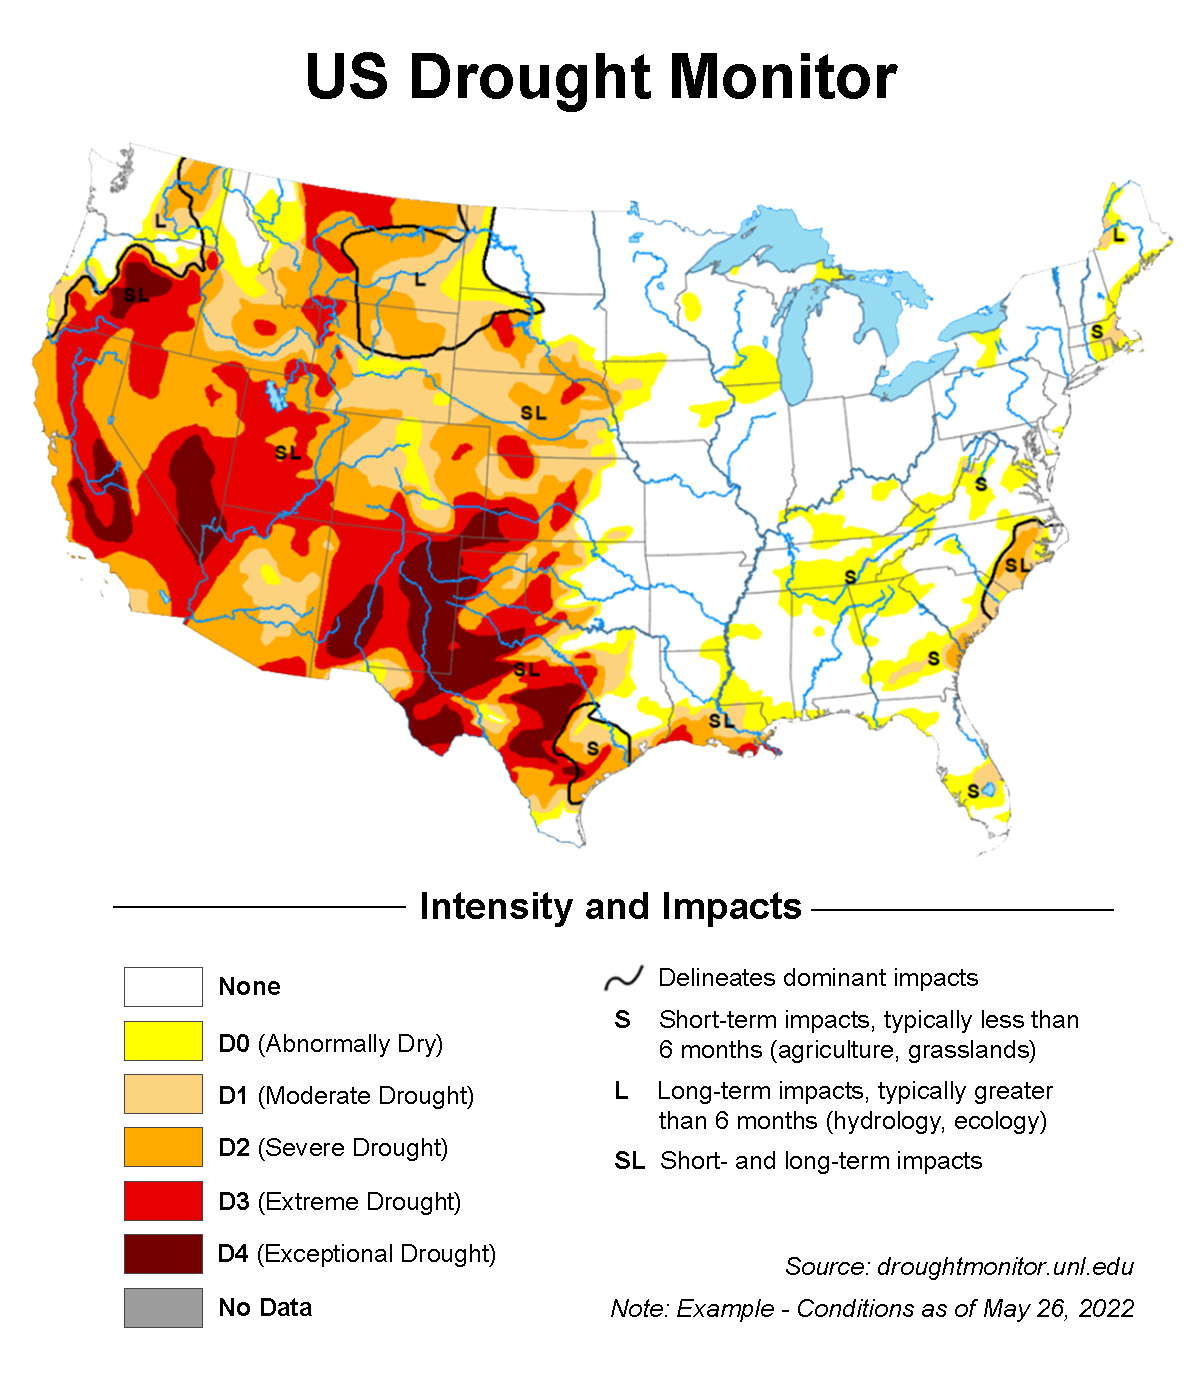
 Summer is almost here, and the US Drought Monitor indicates more than half the nation is currently experiencing moderate to exceptional drought conditions.
The US Drought Monitor, which is updated weekly, provides categorical data on the severity of drought conditions throughout the country and its major territories at a detailed geographical level, along with discussions around current and projected near-term conditions.
It is produced jointly by the National Drought Mitigation Center (NDMC) at the University of Nebraska-Lincoln, the National Oceanic and Atmospheric Administration (NOAA), and the US Department of Agriculture (USDA).
Their website includes a variety of mapping features, the ability to download data in both text and GIS formats, and a tool to determine if your county qualifies for the USDA Farm Service Agency’s Livestock Forage Disaster Program.
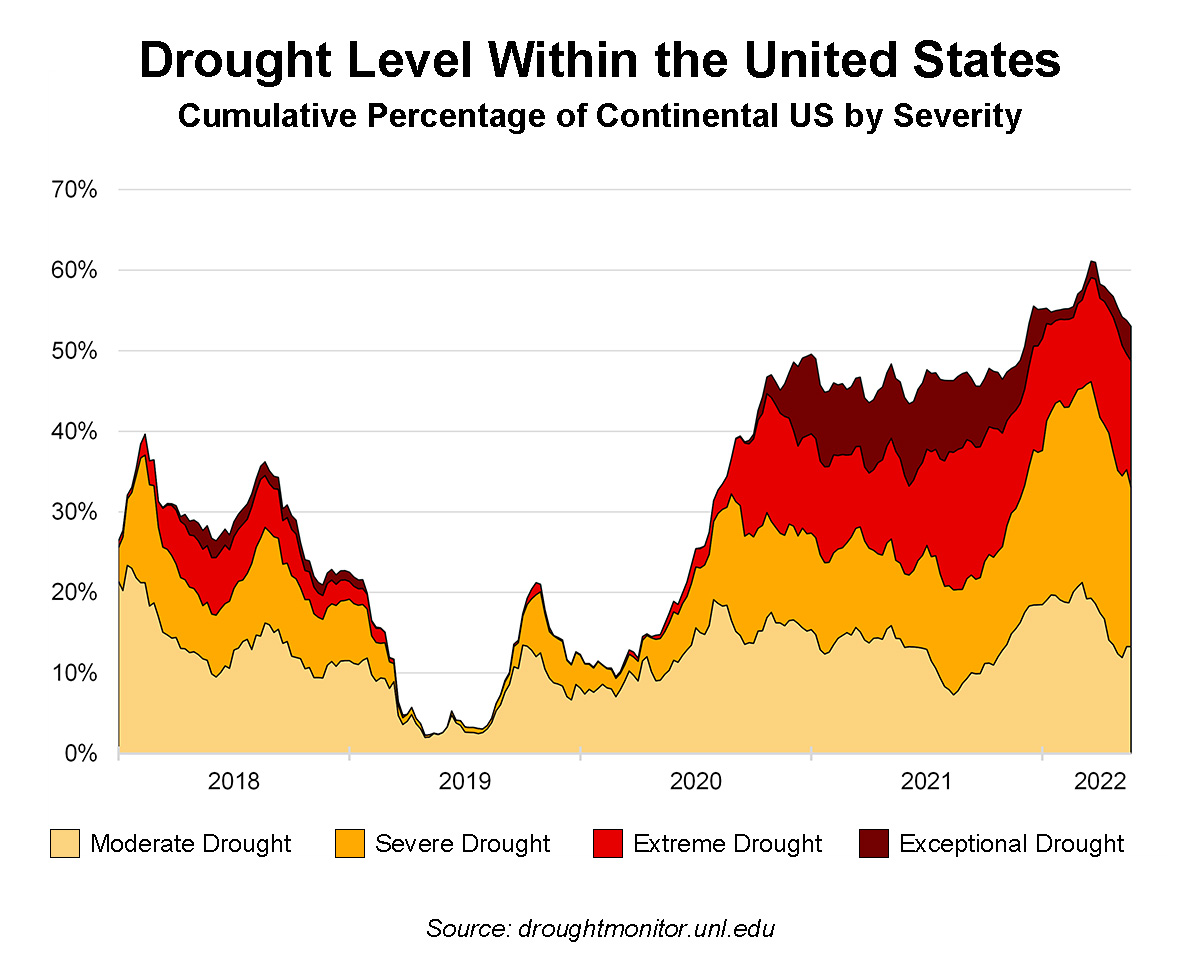 Since late 2021, more than half of the United States has been under moderate drought conditions or worse. What’s more, these areas are home to more than one in four people in the country. This stands in stark contrast to levels seen as recently as 2020 when that measure remained below 20% for the first five months of the year.
As for the most acute conditions, fully 20% of the country falls into the extreme and exceptional drought categories — a measure that saw its most recent peak in August 2021, reaching a worryingly high 27%.
Regionally the percentages differ drastically. As of late May 2022, the percent of land area experiencing moderate drought conditions or worse in the Northeast and Midwest was in the low single digits (2% and 1%, respectively). The Southeast rated 11% while the South and West each hovered around 50%. The region defined as the High Plains, however, stood at over 70%.
Different governmental organizations base their policies around disaster declarations and program eligibility on the US Drought Monitor. Beyond those cases, current and accurate information is key to guiding public policy regarding water use by households, industry, and agriculture. Extending back to the year 2000, the data allows people to understand how these conditions have changed within their specific location and it can inform decisions around water storage capacity, flood control, hydropower, fire preparedness, and more.
Many water-related policies focus on reducing demand with the goal of water security through sustainable use. Uncertainty around climate conditions puts a premium on quality data and the US Drought Monitor provides a consistent, robust, and publicly available dataset for use by individuals, communities, and government agencies.
_______________________________
The US Drought Monitor is jointly produced by the National Drought Mitigation Center (NDMC) at the University of Nebraska-Lincoln, the United States Department of Agriculture, and the National Oceanic and Atmospheric Administration. Map courtesy of NDMC.
_______________________________
Learn more about Camoin Associates’ Industry and Workforce Analytics services.

Workforce Development
What’s the best way to engage with young people in order to pique their interest in career opportunities in different sectors? Find out what a group of high school students recently told our author.

Industry Analytics

Economic & Fiscal Impact Analysis
Your resource for understanding today and looking toward tomorrow